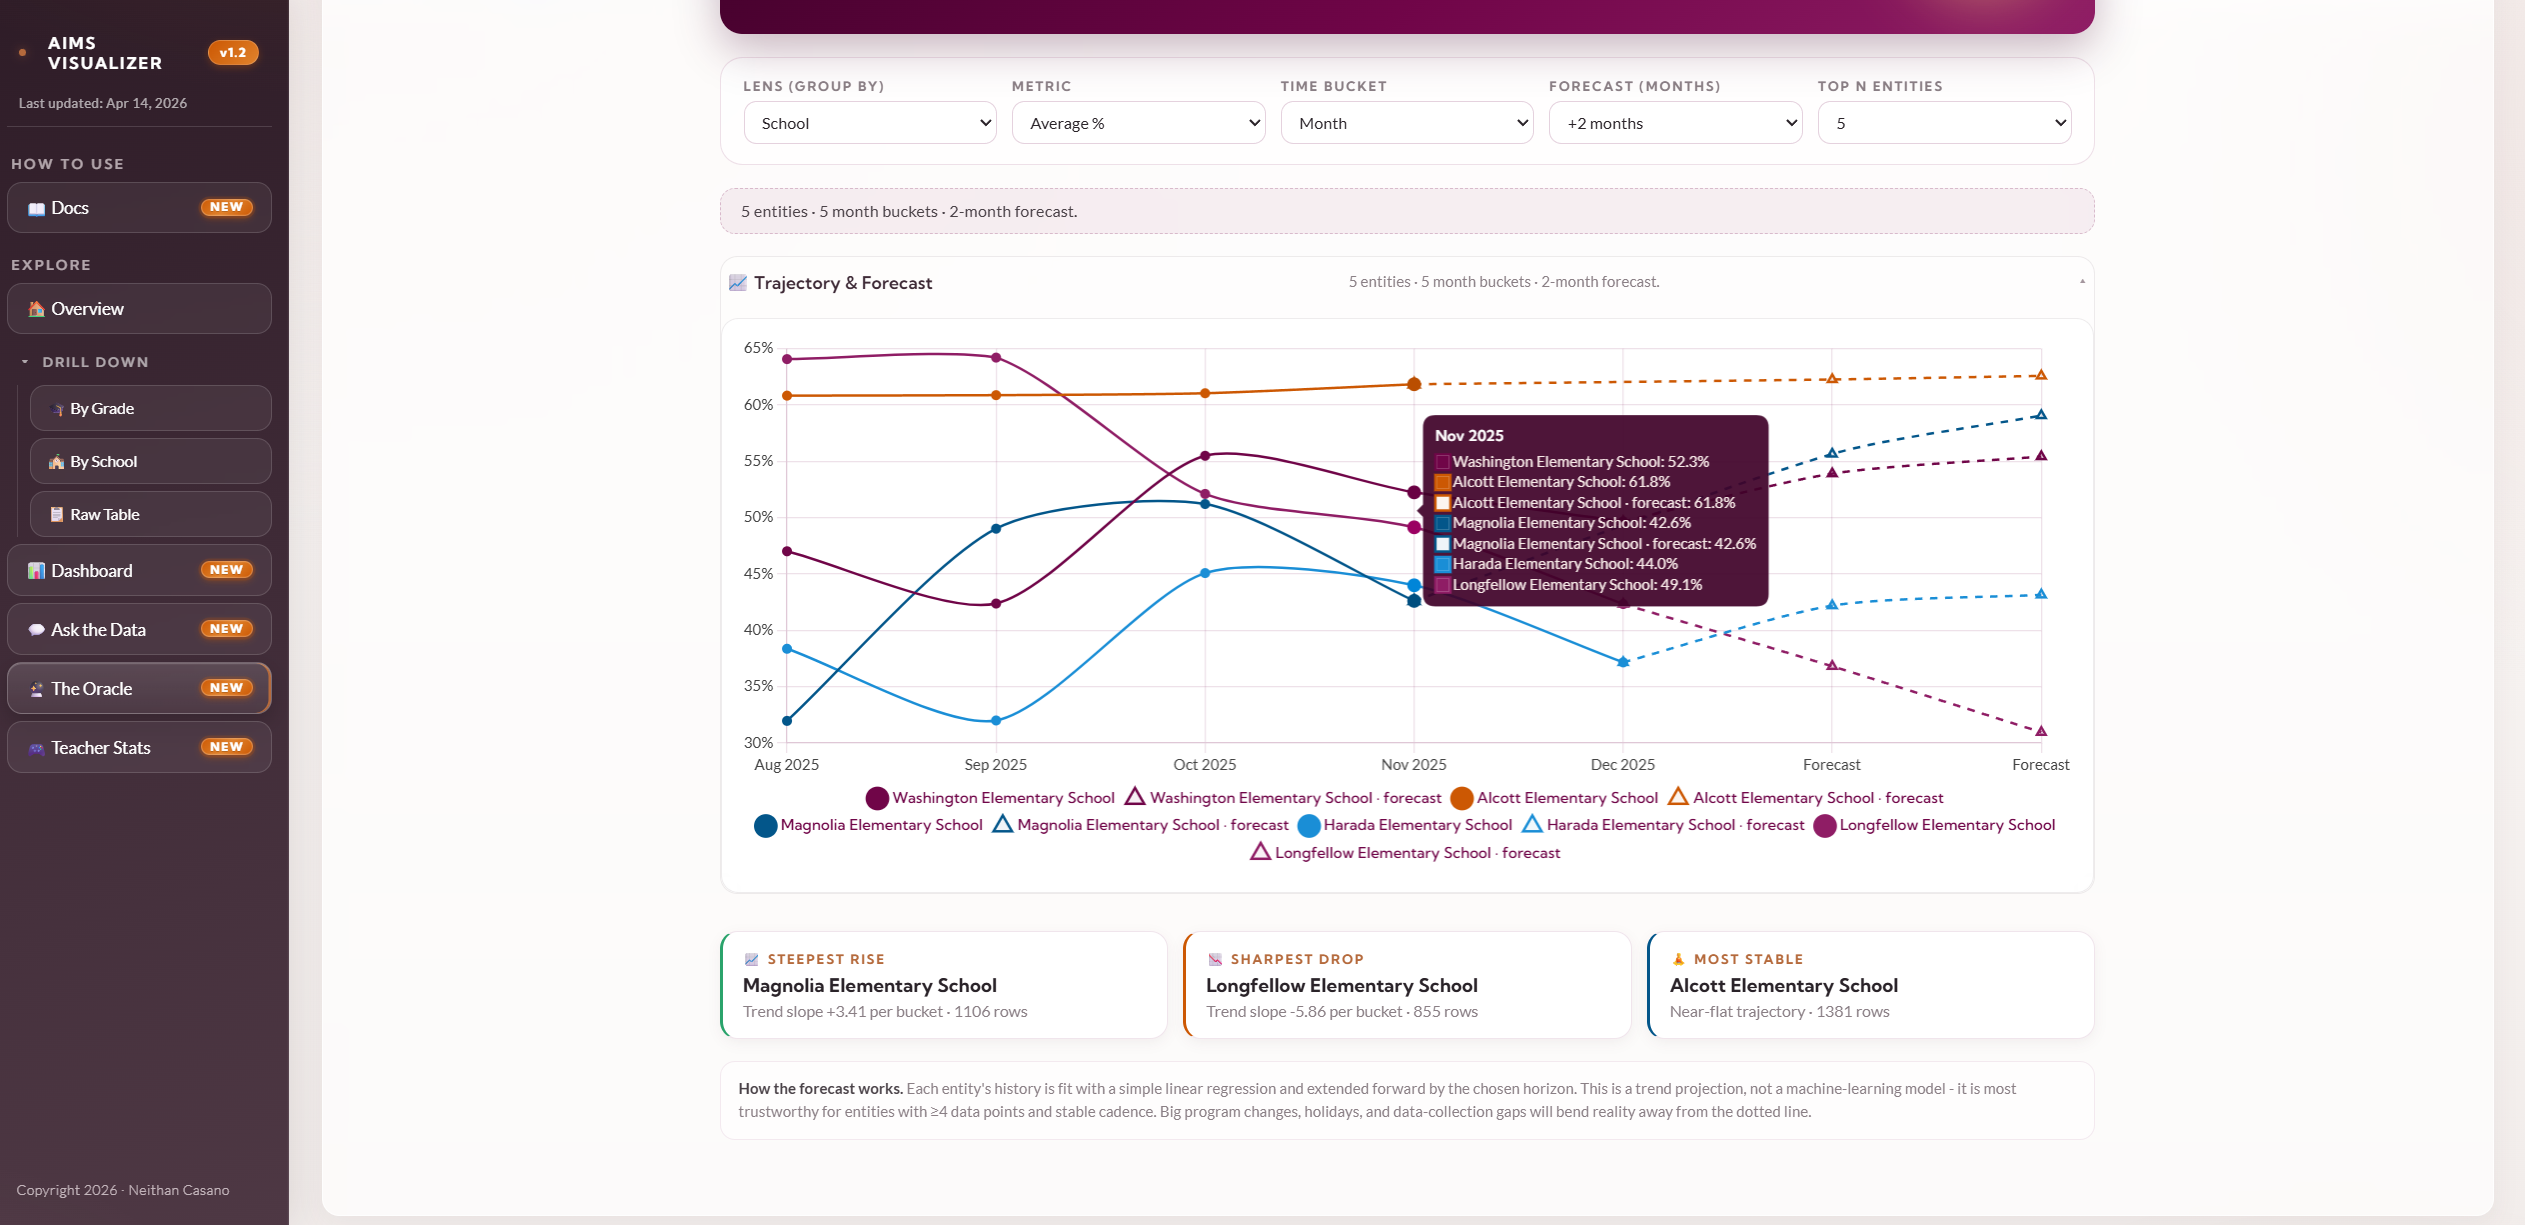
The AIMS Visualizer is the natural next version of the visualizer we built for RPPL at Brown University in a previous engagement, and we couldn't be happier with how it turned out. Where the RPPL build laid the groundwork for secure, construct-driven visualization inside a research environment, this one steps fully into the modern era, leaning into the tactile, game-like interfaces we usually only see in titles people play for fun.
The work was done for the AIMS Collaboratory, a Gates Foundation-supported community of practice that brings together math curriculum developers, technologists, researchers, and school districts to build better tools, products, and instructional strategies for how children learn math. It's the kind of mission that deserves software that doesn't feel like work to use, and that's exactly what we set out to make.
The platform spans an analysis workspace with live filters and dashboard snapshots, an Ask the Data coach-tone chat surface, an Oracle trajectory-and-forecast engine, and a Teacher Stats page that styles teacher rubric data as RPG-style stat sheets with HP/MP-style bars, Power Level orbs, Level badges, and a character-select grid. The choices were deliberate.
There's a saying that there are only three industries on planet Earth that have truly mastered engagement: gambling, sex, and games. We borrowed shamelessly from the third, the tactile feedback, the visible progression, the satisfying read of a radar chart that tells you everything at a glance, and applied it to a noble cause: helping coaches, researchers, and educators actually see their data and act on it.
There's something deeply satisfying about taking the same design principles that keep people glued to their phones at 2am and pointing them at a problem that matters. We're proud of what AIMS Visualizer has become, and prouder still of the team using it.